The State of Cost Engineering 2026
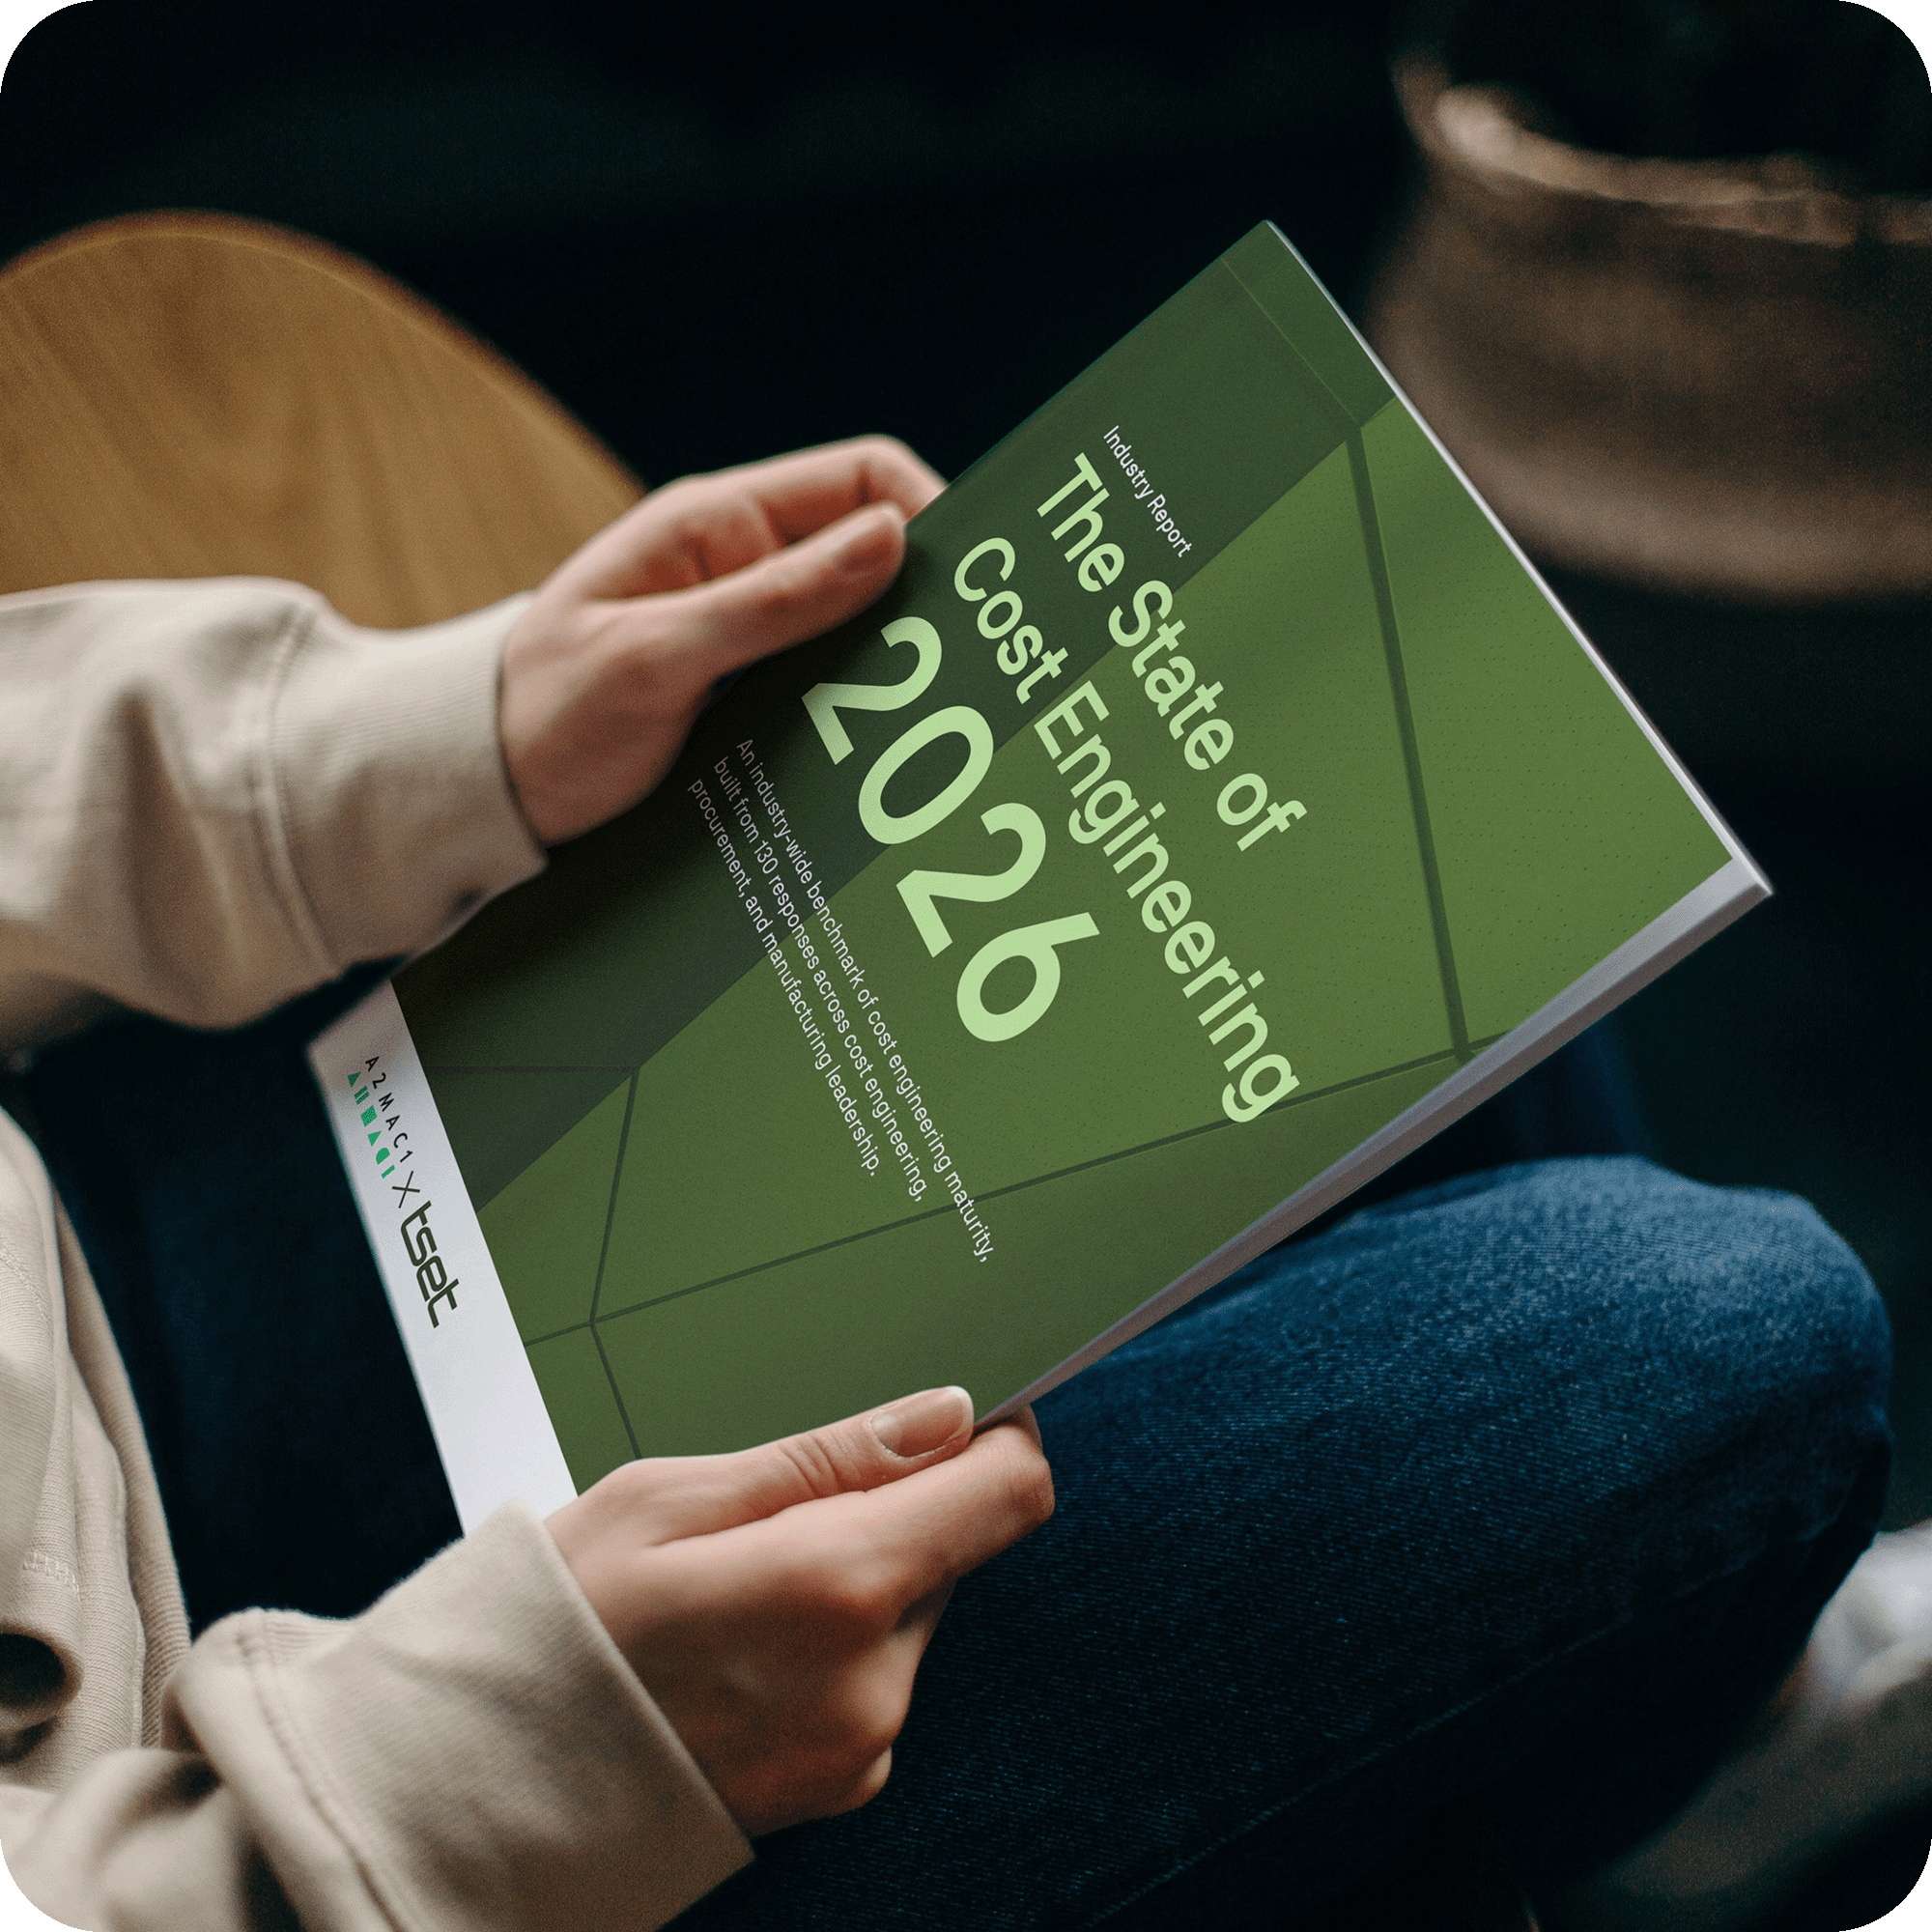
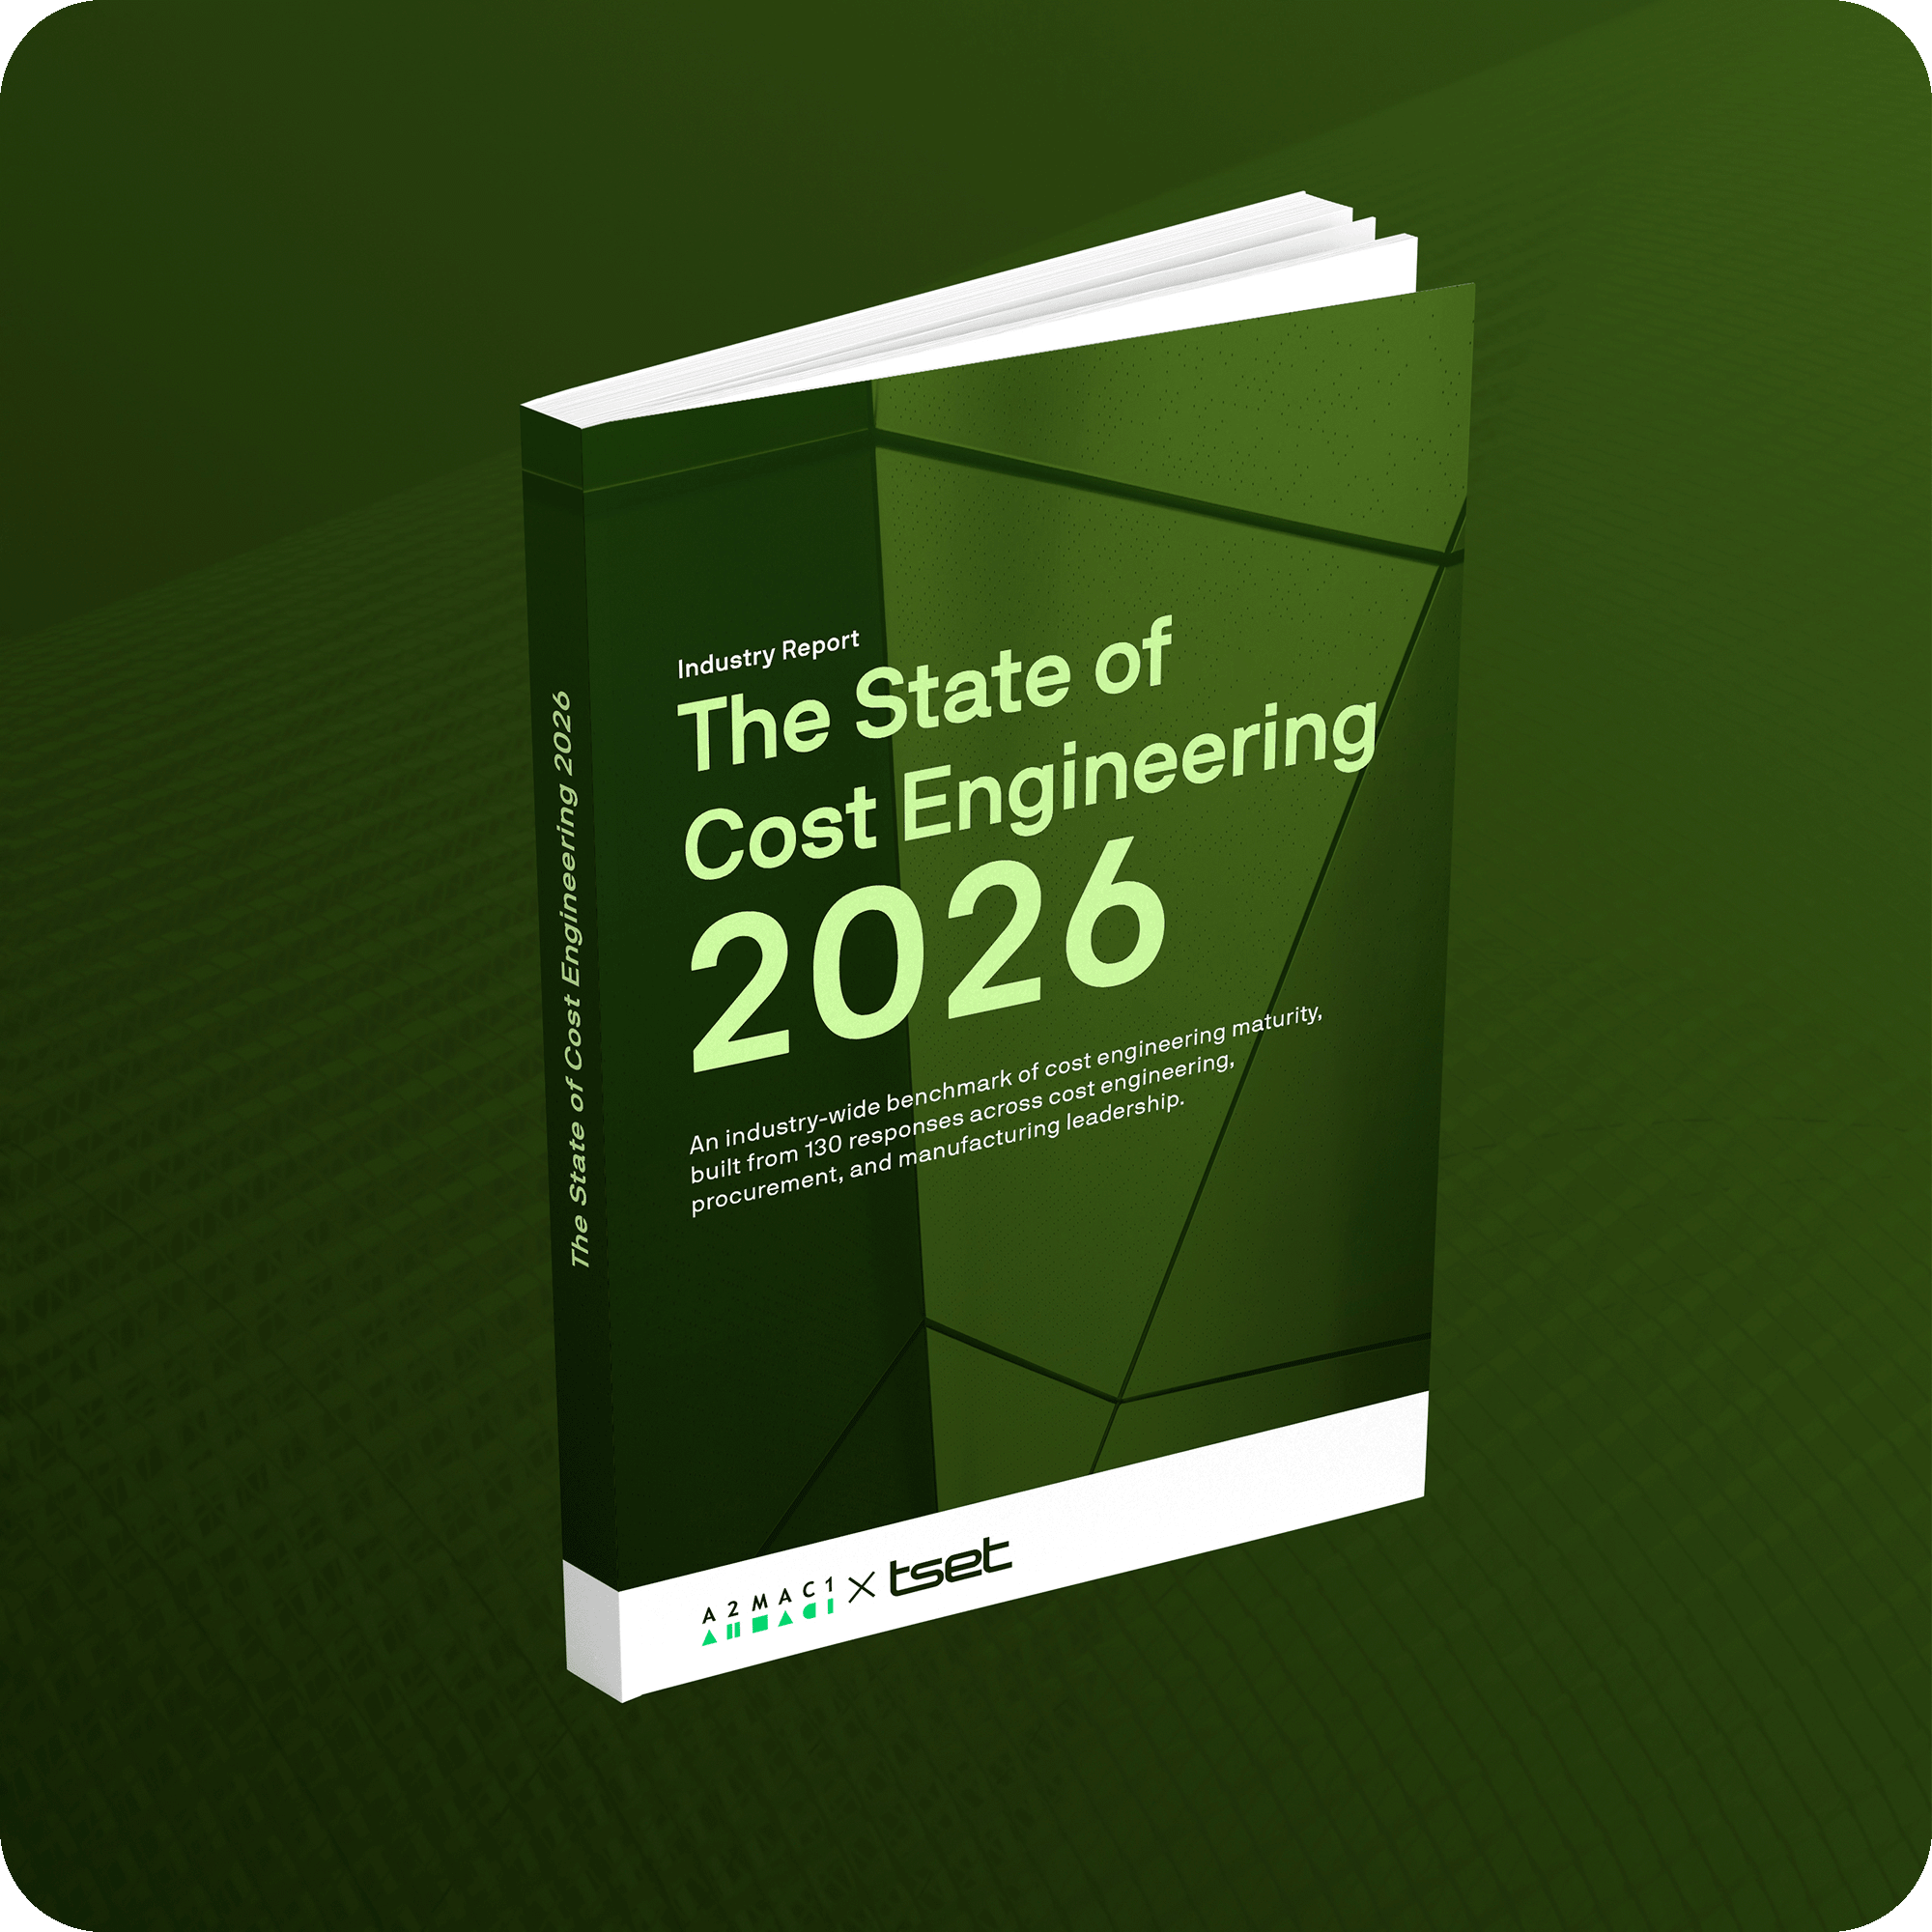
An industry benchmark of cost engineering maturity, built from 130 responses across cost engineering, procurement, and manufacturing leadership.
Co-published by Tset in partnership with A2MAC1.
0
Survey responses
0
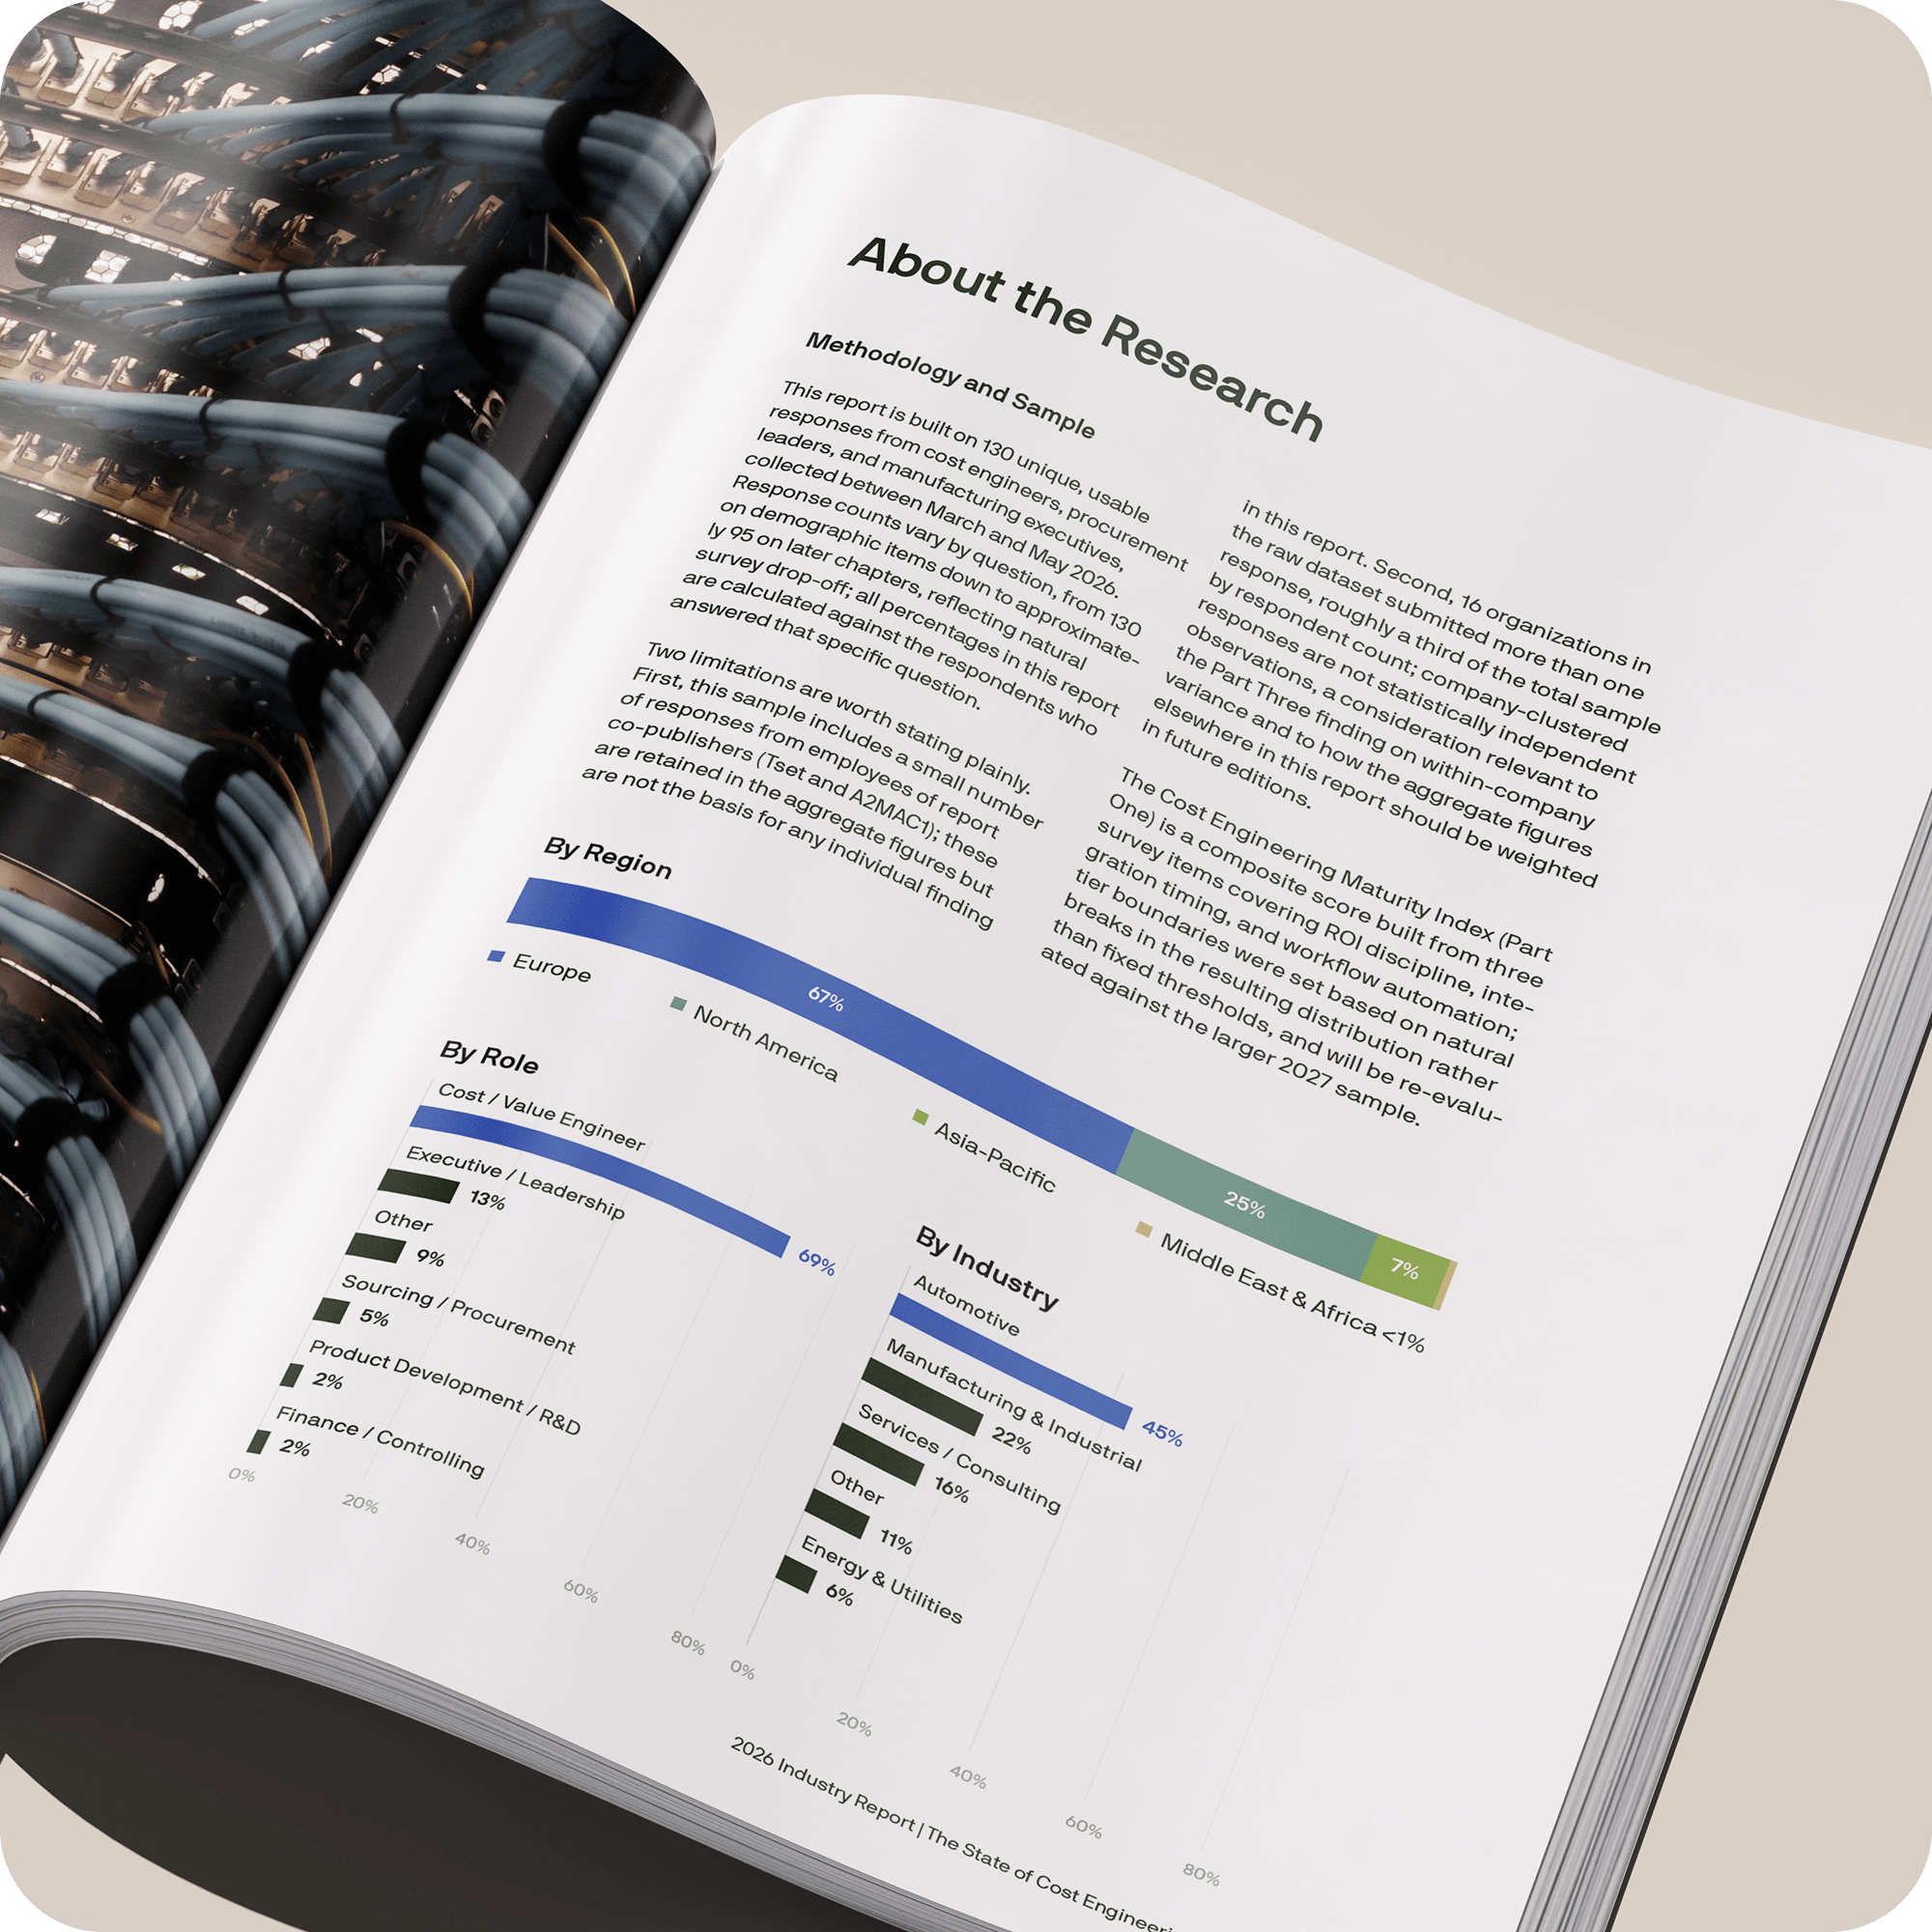
Industries represented
0 %
Respondents based in Europe
0 %
Cost and value engineers respondents
Presented by research partners
Tset joined A2MAC1 and SPCEA to combine their respective knowledge domains, data, client relationships, and market perspectives into one benchmark.


No single company sees the whole picture. This report does.
Cost engineering is being asked to do more than it was ever built to do, faster than most teams have been able to grow their capacity, tools, or headcount. This report is built on 130 responses from cost engineers, procurement leaders, and manufacturing executives, collected March–May 2026, primarily across Europe (67%) and North America (25%).
At its center is the Cost Engineering Maturity Index, scoring organizations on ROI discipline, integration timing, and workflow automation, then sorting them into three tiers: Reactive, Developing, and Integrated. It's the lens applied throughout, from the value gap in Part One to the risk map in Part Five. The result is a picture of where the industry is genuinely divided, and what the small group capturing real value is doing differently.
Built for diverse roles in the cost conversation
Each part of the report closes with a distinct set of 90-day, 6-month, and 12-month actions for the four functions that decide whether cost engineering's findings actually turn into savings.
Benchmark your own maturity
See where your organization sits on the Maturity Index, and get a concrete case for a seat at concept phase, backed by industry data rather than internal opinion.
Separate identification from implementation
Understand why savings identified and savings realized are two different metrics, and how to expand coverage without losing capture rate.
Understand the concept-phase advantage
See the data behind why R&D is named as the biggest source of resistance to cost engineering, and what changes when it gets a seat earlier instead.
Size the function against the industry
Benchmark headcount, tooling, ROI tracking, and AI readiness against peers before committing budget to tooling or AI pilots.
The value gap, in three figures
Cost engineering is not struggling to find savings. It is struggling to capture them, and the industry average hides how unevenly that capture is distributed.
Average savings potential identified per analysis, versus an average implementation rate of just 33.8% across proposals.
Of organizations realize almost none of the savings they identify. Only 10% realize 30% or more. Nobody in this industry is actually average.
Expect AI to become central to cost engineering within five years, yet only 7% actively use it today. Data quality and automation, not budget, gate adoption.
Read the full findings now
Skip ahead and get the full report, free, with the complete methodology and the 90-day action plan for your role.
Six findings that anchor this report
Cost engineering has never mattered more, and the data behind that claim is, for the first time, shared across the industry rather than held by any single company.
Importance has grown sharply, driven by margin pressure
73% of organizations report increased importance for cost engineering over the last two years, driven by margin pressure rather than passing inflation.
The value gap is a polarized split, not a uniform leak
41% of organizations realize almost none of the savings they identify; 10% realize 30% or more. The industry average obscures a much sharper divide.
AI ambition is running far ahead of AI readiness
65% expect AI to become central within five years; 7% use it today. Data quality and automation, not budget or ambition, are what gate adoption.
What's covered, part by part
Six parts, from the value gap to a concrete 2027 roadmap.
The Value Gap
Why cost engineering has never mattered more, and the polarized reality behind the industry's savings-capture numbers.
What Separates Leaders From Laggards
The concept-phase advantage, what dedicated software actually buys you, and why ROI tracking buys credibility before performance.
The Confidence Paradox
Why the least-equipped teams feel the safest, and why perception varies even within a single organization.
The Foundations Problem
Data quality, the automation gap, the knowledge cliff, and the honest state of AI ambition versus AI readiness.
The Risk Map
Eight strategic risks, why resistance has a specific address, and why mid-size teams carry the most exposure.
Action
What this means for cost engineers, procurement, engineering, and executives, at 90 days, 6 months, and 12 months. Plus a look ahead to 2027.
Find out where you stand, and exactly what to fix first
The State of Cost Engineering 2026 is free to download. Benchmark your organization against 130 industry peers on the Maturity Index, and get the specific 90-day, 6-month, and 12-month actions for cost engineers, procurement, engineering, and executives.
Co-published by Tset and A2MAC1.